Open a fan datasheet and the performance graph can look like the least friendly part of the page. It is actually the part that tells you what the fan will do after you install it.
A fan may be listed at 200 CFM, but that does not mean it will deliver 200 CFM inside a cabinet. Add a filter, a grille, a heat sink, or a narrow air path and the airflow drops. The fan curve shows how much airflow remains as the pressure requirement rises.
Once you know how to read a fan curve, product selection becomes much less guesswork. You can compare fans at the pressure your system actually creates, find the expected operating point, and avoid choosing a model from its maximum-airflow number alone.
The short version: the fan curve tells you what the fan can provide. The system curve tells you what the installation demands. Where the two curves cross is the airflow and pressure you are likely to get.
Key Takeaways
- The horizontal axis normally shows airflow; the vertical axis normally shows pressure.
- Maximum airflow and maximum static pressure occur at opposite ends of the curve. They are not available at the same time.
- The actual operating point is where the fan curve intersects the system resistance curve.
- A filter, grille, heat sink, duct, or tight enclosure shifts the operating point toward lower airflow.
- Always compare curves at the correct voltage, frequency, speed, air density, and test condition.
What a Fan Curve Actually Tells You
A fan does not have one fixed airflow. It has a range of possible airflow-and-pressure combinations. The fan performance curve is a map of those combinations for a particular fan running under stated conditions.
For a compact axial or centrifugal cooling fan, the main graph is often called a P-Q curve. P represents pressure and Q represents airflow. As the fan faces more resistance, it moves less air. That is why the curve usually slopes downward from left to right.
Some datasheets show more than one line. Those lines may represent different speeds, voltages, frequencies, blade angles, or control settings. Other charts may add input power, efficiency, current, or noise. Before reading any number, check the legend and test notes.
Know the Axes Before You Read the Curve
Most fan curves use airflow on the horizontal x-axis and pressure on the vertical y-axis. The units vary by market and fan type, so it is worth checking them every time.
| Quantity | Common Units | What It Tells You |
| Airflow | CFM, m³/h, m³/min, L/s | How much air moves through the system. |
| Static pressure | Pa, mmH₂O, inH₂O | How much resistance the fan can overcome at a given airflow. |
| Fan speed | RPM | The rotational speed used to produce that curve. |
| Electrical input | W, kW, A | Power or current required at a given operating condition. |
| Sound | dBA | The measured noise level under the stated test condition. |
Do not compare a curve in CFM and inches of water directly with a requirement written in m³/h and Pa. Convert the units first. Small conversion mistakes can move the selection far enough to matter.
Related guide: Static Pressure vs Airflow Fans explains what the two specifications mean in practical cooling applications.
The Two Endpoints: Free Delivery and Shut-Off
Maximum Airflow at Free Delivery
At the far right of the curve, pressure is close to zero and airflow is at its maximum. This is commonly called free delivery or free-air airflow. It is useful for comparing fans, but it is rarely the airflow you will see inside real equipment.
Even a simple finger guard, vent opening, or nearby component adds some resistance. A filter, radiator, or dense heat sink adds much more.
Maximum Pressure at Shut-Off
At the far left of the curve, airflow is zero and pressure is at its maximum. This point may be called shut-off, block-off, or maximum static pressure. It does not mean the fan is cooling anything. There is pressure, but no useful airflow.
A common selection mistake is to place maximum airflow and maximum pressure together as if the fan can deliver both. It cannot. Those values belong to opposite ends of the same curve. A real installation normally operates somewhere between them.
The Operating Point: Where Fan and System Meet
The fan curve is only half of the picture. Your enclosure, duct, filter, guard, and internal layout create a system resistance curve. That curve normally rises as airflow increases because pushing more air through the same path requires more pressure.
The fan and the system settle at the point where the available pressure equals the required pressure. That intersection is the operating point, sometimes called the duty point. It gives you the expected airflow and static pressure during operation.
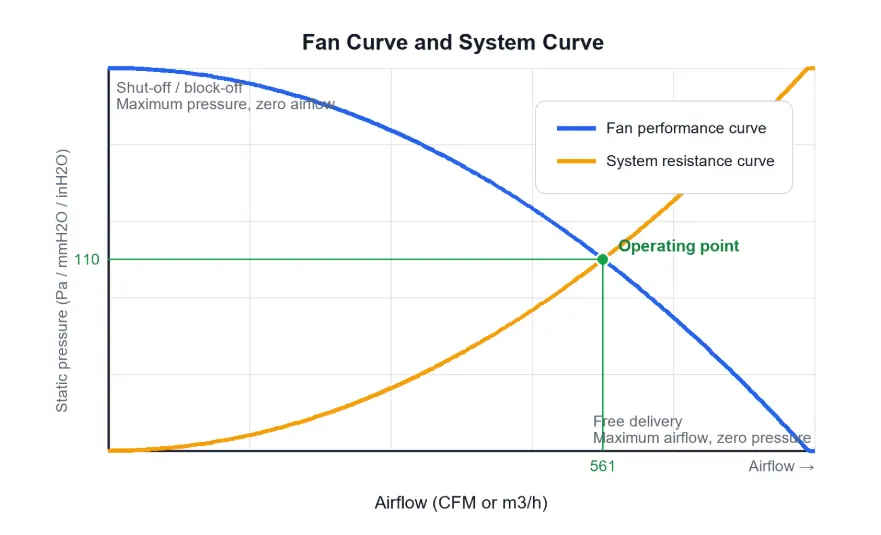
Figure 1. The operating point is where the fan performance curve and system resistance curve intersect. Illustrative data only; use the actual curve for the selected model.
The important point is that you do not choose an operating point independently. The combination of fan and system creates it. Change the fan and the point moves. Change the filter, vent, duct, or cabinet layout and it moves again.
How to Read a Fan Curve Step by Step
- Confirm the curve belongs to the exact fan. Check the model number, voltage, frequency, speed, and control setting. Two fans with the same frame size can have very different curves.
- Check the test conditions. Look for air density, temperature, test standard, inlet condition, and whether the graph shows static or total pressure.
- Find your required airflow. Start from the cooling or ventilation requirement. Locate that airflow on the horizontal axis and move upward.
- Find your system pressure. Locate the expected pressure loss on the vertical axis and move across. The airflow and pressure requirement must be met at the same point.
- Compare the requirement with the fan curve. If the required point lies above the fan curve, that fan cannot provide enough pressure at the target airflow. If it lies below the curve, the fan may have capacity available.
- Add or estimate the system curve. The intersection with the fan curve gives the expected operating point. A measured pressure-and-flow point is better than a guess.
- Check the operating region. Avoid unstable areas, obvious stall regions, and selections right at the edge of the curve. Leave sensible margin for filter loading and manufacturing tolerance.
- Review power, noise, and speed. A fan that meets airflow and pressure may still be too loud, draw too much current, or run outside the preferred control range.
A Simple Worked Example
Suppose an electrical enclosure needs at least 500 CFM. At that airflow, the filter, grille, and internal air path are estimated to create 90 Pa of pressure loss.
On the candidate fan curve, locate 500 CFM on the x-axis and move upward. If the curve is still above 90 Pa, the fan has enough pressure capability at that airflow. If the curve is below 90 Pa, the real airflow will settle below the target.
Now add the system curve. In the illustration above, the curves cross at roughly 560 airflow units and 110 pressure units. That crossing point, not the maximum CFM printed at the end of the fan curve, is the useful prediction.
Next, consider the dirty-filter condition. As the filter loads, the system curve becomes steeper and the intersection moves left. Airflow falls even though the fan speed has not changed. This is why a design that only works with a brand-new filter usually has too little margin.
What Makes the Operating Point Move?
It helps to separate changes to the fan from changes to the system. They affect different curves.
| Change | Curve Affected | Likely Result |
| Fan speed increases | Fan curve | Available airflow and pressure rise; power and noise normally rise too. |
| Filter becomes dirty | System curve | Resistance increases and the operating point shifts toward lower airflow. |
| Vent opening gets larger | System curve | Resistance decreases and the operating point shifts toward higher airflow. |
| A restrictive heat sink is added | System curve | More pressure is required at the same airflow. |
| A different fan is installed | Fan curve | The operating point moves to the intersection with the new fan curve. |
| Air density changes | Fan performance | Pressure, power, and cooling behavior may differ from catalog test conditions. |
How Fan Speed Changes the Curve
For the same fan and similar air conditions, the fan laws give a useful first estimate: airflow changes roughly in proportion to speed, pressure changes roughly with the square of speed, and power changes roughly with the cube of speed.
That means a modest increase in RPM can require a much larger increase in power. It also means slowing a controllable fan can save energy quickly. Treat the fan laws as an estimate and confirm the result with the manufacturer’s curves, especially near stall, at very low speed, or when air density changes.
How Filters and Restrictions Change the System Curve
A filter does not change the fan curve. It changes the system curve. The same is true for a smaller grille, a sharper bend, a crowded inlet, or a narrow outlet.
When installed airflow is low, replacing the fan is not always the best first move. A larger vent, better inlet clearance, a lower-resistance filter, or a cleaner internal air path may recover airflow without adding motor power or noise.
How Different Fan Types Look on a Curve
Axial Fans
Axial fans are compact and well suited to moving substantial airflow through open or moderately restricted paths. Their curves may include a dip or unstable region as the fan approaches stall. Do not assume every point on the line is equally desirable.
Centrifugal Fans and Blowers
Centrifugal fans generally provide stronger pressure capability for filters, heat exchangers, narrow channels, and ducted paths. However, the label alone is not enough. Compare the actual fan curve at the required duty point.
DC and EC Fans with Speed Control
A controllable DC or EC fan may show several speed curves. The higher-speed curve sits above and to the right of the lower-speed curve. Use the curve that matches the planned PWM signal, control voltage, or programmed speed, then check current and noise at that setting.
Common Fan Curve Mistakes
- Selecting from maximum CFM without checking pressure at the real operating condition.
- Combining maximum airflow and maximum pressure as though they occur together.
- Reading total pressure as static pressure, or comparing curves that use different definitions.
- Mixing CFM, m³/h, Pa, mmH₂O, and inH₂O without converting the units.
- Ignoring voltage, 50/60 Hz frequency, fan speed, air density, or test setup.
- Using a clean-filter curve for a system that must operate for months between maintenance visits.
- Placing a wall, cable bundle, or component too close to the fan inlet and then blaming the fan.
- Choosing an operating point in an unstable region or leaving no margin for normal variation.
What to Ask a Fan Manufacturer For
- If a catalog only lists maximum airflow and maximum static pressure, ask for the complete performance curve. For a useful comparison, request:
- The P-Q curve for the exact model, voltage, frequency, and speed.
- Current or input-power data across the operating range.
- Noise data and the measurement condition.
- The test standard, air density, and temperature used for the curve.
- Performance tolerance and the recommended operating region.
- Expected life, bearing type, environmental rating, and temperature limits.
Also send the supplier information about your system: target airflow, estimated pressure loss, filter details, available space, voltage, ambient temperature, noise target, and a drawing of the airflow path. That is far more useful than asking for the fan with the highest CFM.
Practical Selection Checklist
- Define the required airflow from the heat load or ventilation target.
- Estimate or measure system resistance at that airflow.
- Confirm pressure and airflow units.
- Use the exact fan curve for the planned voltage, frequency, and speed.
- Find the fan-and-system operating point.
- Check the clean-filter and dirty-filter conditions.
- Review power, current, noise, life, and environmental limits.
- Prototype the installation and measure temperatures or airflow before final release.
Read the Curve Before You Compare Catalog Numbers
A fan curve turns a pair of maximum specifications into a realistic performance prediction. It shows the trade-off between airflow and pressure, while the system curve shows the resistance created by the installation. Their intersection tells you where the fan will actually work.
The process does not need to be complicated: confirm the axes and units, locate the required airflow and pressure, find the operating point, and leave practical margin for filters and installation effects. That simple check can prevent overheating, excess noise, and repeated fan changes later.
If you are comparing AC, DC, EC, or centrifugal cooling fans, send LINKWELL your airflow target, system pressure loss, voltage, available space, and environmental conditions. The engineering team can help narrow the options and provide the relevant performance curves for prototype testing.
How to Read a Fan Curve FAQ
What is a P-Q curve?
A P-Q curve is a fan performance graph showing the relationship between pressure (P) and airflow (Q). It shows how much airflow the fan can deliver as the pressure requirement changes.
Where is the fan operating point?
The operating point is where the fan performance curve intersects the system resistance curve. At that point, the pressure produced by the fan matches the pressure required by the system.
Why is installed airflow lower than the catalog airflow?
Catalog maximum airflow is normally measured near zero pressure. Filters, grilles, heat sinks, ducts, and crowded components create resistance, so the installed fan operates at a lower-airflow point on its curve.
Can I select a fan using maximum CFM only?
Not reliably. Maximum CFM is a free-air endpoint. Select the fan by checking whether it can provide the required airflow at the system’s expected pressure loss.
What if I do not have a system curve?
Start with component pressure-drop data or measure one airflow-and-pressure point on a prototype. For many fixed systems, that point can be used to estimate a first-pass system curve. Test data should take priority over a rough estimate.
Does a higher fan speed always produce more airflow?
Usually, but the gain depends on the system curve. Higher speed raises the fan curve, while the extra airflow also raises system pressure loss. Check the new intersection rather than assuming the free-air increase will appear in the installation.
How do I read several curves on the same graph?
Use the legend to identify the line for the correct RPM, voltage, frequency, blade setting, or control input. Then read airflow and pressure from that line only. Do not combine values from different speed curves.